The Alliance for a Green Revolution in Africa’s (AGRA) 2017 Africa Agriculture Status Report classifies smallholder farm households into five broad categories: subsistence, pre-commercial, specializing commercial, transitioning, and diversified commercial. These categories are defined in relation to the proportion of crop production sold, and the proportion of income from non-farm sources. EPAR contributed estimates (excel) of the shares of households in each category and their characteristics for this report, using data from the World Bank’s Living Standards Measurement Study – Integrated Surveys on Agriculture (LSMS-ISA) for Ethiopia and Tanzania.
In the following interactive data visualizations we explore the usefulness of the AGRA classifications for differentiating among smallholder farm households. We draw on LSMS-ISA data related to income, farm size, and assets of households across Ethiopia and Tanzania. See the tables at the bottom of this page for more information on the sample and variable definitions.
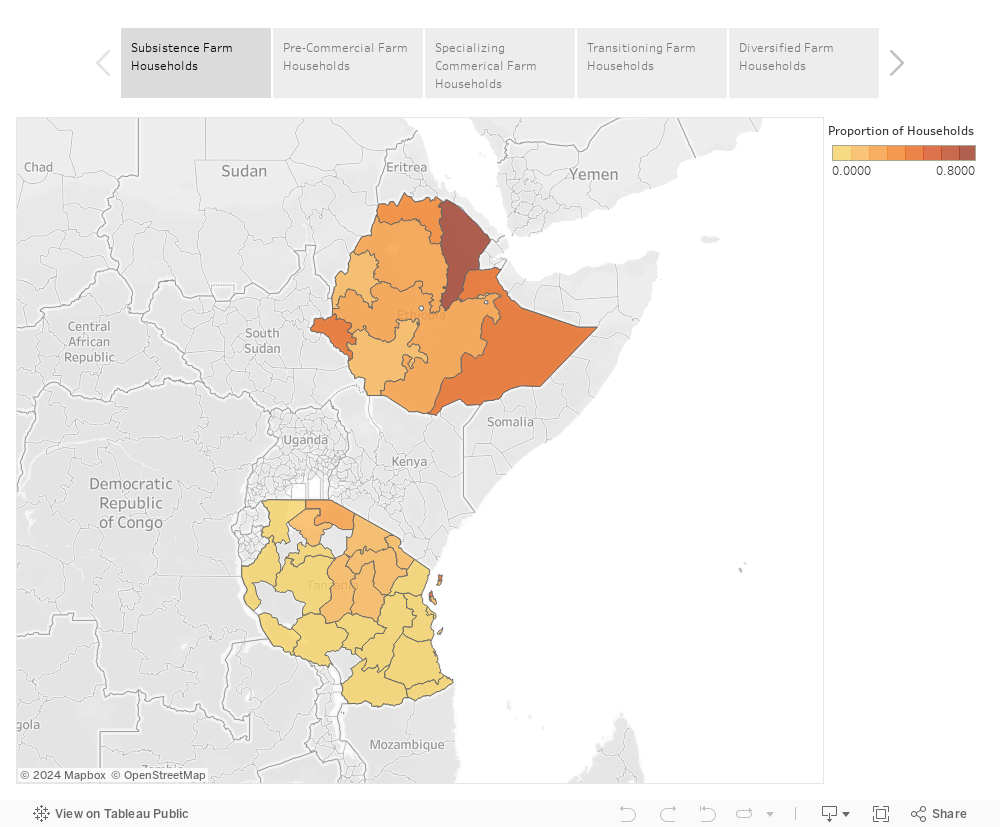
Please note: The farm categorization is intended to focus on smallholder farm households, so it may not be appropriate for urban households, households with no landholdings, or households with large landholdings.
Summary of Smallholder Farmer Households in Ethiopia and Tanzania:
To view this visualization in full-screen, visit the Tableau page here.
The Data
The World Bank’s Living Standards Measurement Study – Integrated Surveys on Agriculture (LSMS-ISA) is a publicly available household panel survey dataset for seven countries in Sub-Saharan Africa. The survey includes linked agricultural, livestock, household, and community level modules that provide information on a variety of topics including crops, farming practices, livestock, income sources, and socio-demographics.
This visualization displays cleaned data from one panel of the Tanzania National Panel Survey (Year 3, 2012-2013), and one panel from the Ethiopia Socioeconomic Survey (Year 2, 2013-2014). The data for the upper visualization are not weighted, and therefore do not reflect nationally representative estimates. The data for the lower map visualization are weighted, and do reflect nationally representative estimates.
The code used to generate the variables and estimates in the AGRA report and in the data visualization is available in a public GitHub repository.
Variable Definitions
- Farm Categories: The five farm categories—subsistence, pre-commercial, specializing commercial, transitioning, and diversified—are based on typology definitions from the AGRA 2017 Africa Agriculture Status Report. They are defined in relation to the proportion of crop production sold, and the proportion of income from non-farm sources.
- Subsistence: Proportion of crop production sold is less than or equal to 5% of total crops produced, and the proportion of income from non-farm sources is less than or equal to one third of total income.
- Pre-commercial: Proportion of crop production sold is greater than 5% and less than or equal to 50% of total crops produced, and the proportion of income from non-farm sources is less than or equal to one third of total income.
- Specializing commercial: Proportion of crop production sold is greater than 50% of total crops produced, and the proportion of income from non-farm sources is less than or equal to one third of total income.
- Transitioning: Proportion of crop production is greater than 5% and less than or equal to 50% of total crops produced, and the proportion of income from non-farm sources is greater than one third of total income.
- Diversified: Proportion of crop production is greater than 50% of total crops produced, and the proportion of income from non-farm sources is greater than one third of total income.
- Farm Size: We define farm size as the total area of plots the household uses for agriculture (either cultivated or fallow) during the survey period. In accordance with the AGRA report, smallholder farmers are defined as households with a farm size smaller than or equal to four hectares, though we include a separate threshold at equal to or below two hectares.
- Total Farm Income: Calculated as the sum of net crop income, net livestock income, and wages from agricultural labor. Net crop income is calculated as the total value of crop production over the year, minus the value of crops lost post-harvest and all expenses from crop production. Net livestock income is calculated as the value of livestock sales and livestock byproduct production, minus the costs of livestock management and production. Wages from agricultural labor are calculated as the wage rate times the number of periods over which the household was paid. The values are converted from local currency to 2014 USD, and cover the last 12 months prior to the survey.
- Total Non-Farm Income: Calculated as the sum of income from non-farm sources. This includes net income from self-employment, wage income from non-agricultural labor, and income from transfers, pensions, governments, remittances, and other sources. The values are converted from local currency to 2014 USD, and cover the last 12 months prior to the survey.
- Total Value of Crop Production: Calculated as the sum of quantity produced times price across crops. If a crop is sold by a household, we use that sales price to value production of the crop. If it is not, we use the median price from the smallest geographic area containing that household with at least ten observations. The values are converted from local currency to 2014 USD, and cover the last 12 months prior to the survey.
- Total Value of Crop Sales: Calculated as the sum of quantity sold times the sales price across crops. The values are converted from local currency to 2014 USD, and cover the last 12 months prior to the survey.
- Importance of Non-Farm Income: The ratio of non-farm income to farm income, where “Low” is defined as <= 1/3 and “High” is defined as >1/3.
- Importance of Farm Sales: The ratio of total value of crop sales to total farm income, where “Low” is defined as a proportion of less than 5%, “Medium” is greater than 5% and less than 50%, and “High” is greater than 50%.
- Farmer Segment: Four farmer segments are defined in the AGRA Report, measured by a farmer’s agricultural potential (based on agroecological factors), and market access (based on distance to the nearest market).
By Annie Rose Favreau and Emily Morton