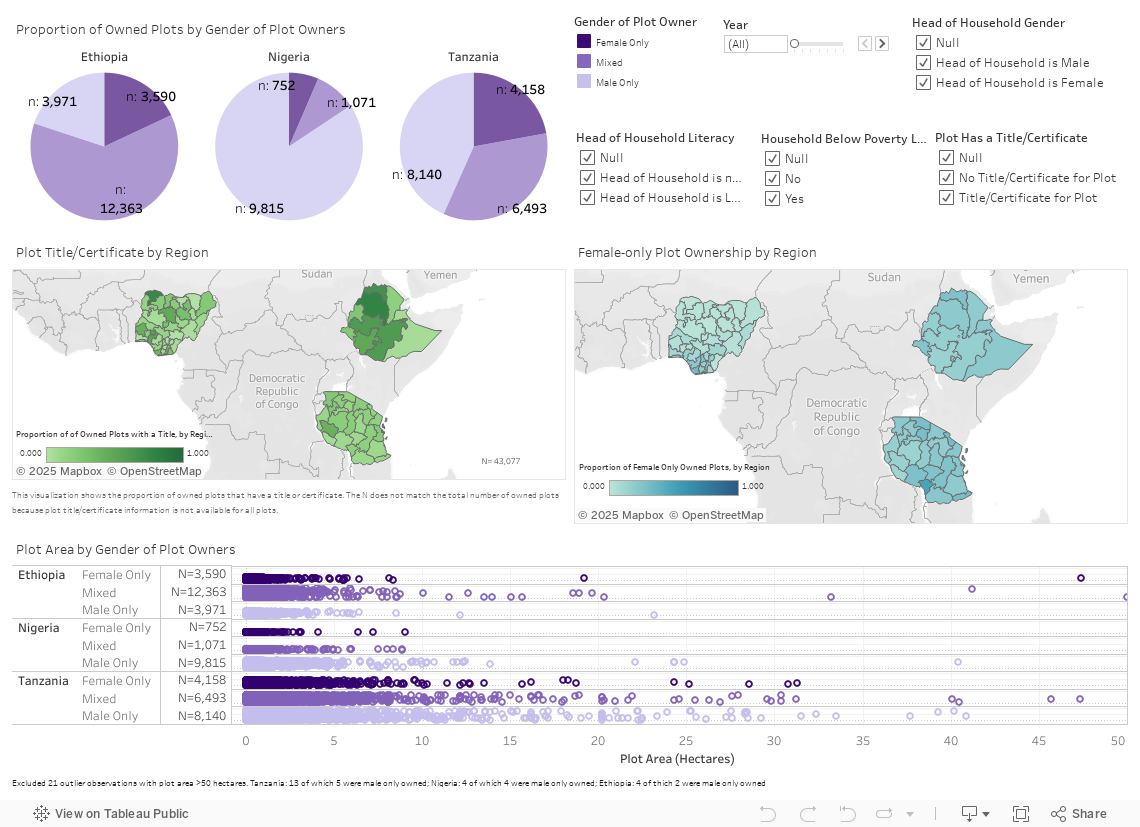
In EPAR Technical Report #357: Review of Land Tenure Technologies and Indicators, we calculated summary statistics for indicators of land tenure using data from the World Bank’s Living Standards Measurement Study – Integrated Surveys on Agriculture (LSMS-ISA). The following dashboard presents an interactive data visualization of the data on plot ownership. See the tables at the bottom of this page for more information on the sample and variable definitions.
To view this visualization in full-screen, visit the Tableau page here.
Hover over specific data points on the figures to discover more information about what data and characteristics they represent. In order to focus the information presented in the charts on a particular variable, either: 1) select a category or a particular data point by clicking on the desired selection in the figure or legend (you can use CTRL to select multiple categories); or 2) select options from the right-hand filter menus. To revert back to a prior selection or reverse your last action, use the undo and redo buttons in the bottom left of the visualization. Clicking the reset button or a blank space in the selected chart will return the visualization to the standard view.
The Data
The World Bank’s Living Standards Measurement Study – Integrated Surveys on Agriculture (LSMS-ISA) is a publicly available household panel survey dataset for eight countries in Sub-Saharan Africa. The survey includes linked plot, household, and community level modules that provide information on crops, livestock, farming practices, and socio-demographics.
This visualization displays cleaned data from four panels of the Tanzania National Panel Survey, two panels from the Ethiopia Socioeconomic Survey, and three panels from the Nigeria General Household Survey.
The calculated summary statistics, which can be found here, are weighted following World Bank recommended methods to produce nationally-representative estimates. The data in the visualization are not weighted.
The Sample
The sample for the figures in the visualization is the set of owned plots only.
| Country/Wave/Year | Total Plots | Total Owned Plots | Percentage of Total Plots that are Owned |
| Tanzania Wave 1 (2008-09) | 5,204 | 4,298 | 82.6% |
| Tanzania Wave 2 (2010-11) | 6,066 | 5,140 | 84.7% |
| Tanzania Wave 3 (2012-13) | 7,474 | 6,319 | 84.5% |
| Tanzania Wave 4 (2014-15) | 4,271 | 3,047 | 71.3% |
| Ethiopia Wave 1 (2011-12) | 10,800 | 0** | n/a |
| Ethiopia Wave 2 (2013-14) | 12,557 | 9,779 | 77.9% |
| Ethiopia Wave 3 (2015-16) | 12,902 | 10,229 | 79.3% |
| Nigeria Wave 1 (2010-11) | 6,517 | 3,845 | 59.0% |
| Nigeria Wave 2 (2012-13) | 6,093 | 3,746 | 61.5% |
| Nigeria Wave 3 (2015-16) | 5,941 | 4,049 | 68.2% |
| All Waves | 77,825 | 50,452 | 64.8% |
**Ethiopia wave 1 is excluded from our visualization because we do not have plot ownership information for all plots
Variable Definitions
Plot Ownership
Questions about plot ownership are not asked in the same way in every country or survey wave. Below are how we defined ownership for each country and wave.
| Tanzania Waves 1-3(2008-09, 2010-11, 2012-13) | Plot ownership status is based on the question “What was the ownership status of this plot?” We define plots as owned if respondents answered “owned” or “shared-own” |
| Tanzania Wave 4 (2014-15) | Plot ownership status is based on the question “How was this plot acquired?” We define plots as owned if respondents answered “inheritance”, “gift”, “purchased”, or “shared-own” |
| Ethiopia Wave 1 (2011-12) | The surveys do not ask whether plots are owned, since land in Ethiopia is held by the state. Ownership information is only available for the subset of owned plots for which the household has a certificate. |
| Ethiopia Wave 2-3 (2013-14, 2015-16) | The surveys do not ask whether plots are owned, since land in Ethiopia is held by the state. We base ownership off of the question “Who in the household can decide whether to sell this plot or use it as collateral?” |
| Nigeria Wave 1-3 (2010-11, 2012-13, 2015-16) | Plot ownership status is based on the question “How was this plot acquired?” We define plots as owned if respondents answered “outright purchased” or if they responded “distributed by the community” or “family inheritance” and someone in the household had the right to sell or use the plot as collateral |
Plot Title
| Tanzania Waves 1-4(2008-09, 2010-11, 2012-13, 2014-15) | Plot title/certificate is based on the question “Did anyone in your household have a title for this plot?” We did not distinguish between types of title/certificate/documentation. |
| Ethiopia Wave 1-3 (2011-12, 2013-14, 2015-16) | Plot title/certificate is based on the question “Does your household have a certificate for this plot?” |
| Nigeria Wave 1 (2010-11) | There is no question about plot title/certificate in this wave. |
| Nigeria Wave 2 (2012-13) | Plot title/certificate is based on the question “Have you or any other household member acquired a legal title that verifies the rights of occupancy to this plot?” In this wave, this question is only asked for purchased plots, so we can only analyze titles among that subset of plots |
| Nigeria Wave 3 (2015-16) | Plot title/certificate is based on the question “Have you or any other household member acquired a legal title that verifies the rights of occupancy to this plot?” In this wave, this question is asked for all plots that were purchased, distributed by the community, or inherited. |
Plot Owner Gender
“Female only” are plots where all listed owners are female. “Male only” are plots where all listed owners are male. “Mixed” are plots where there is at least one male owner and at least one female owner listed.
| Tanzania Waves 1-4(2008-09, 2010-11, 2012-13, 2014-15) | Sex of the plot owner is based on the question “Who in the household owns this plot?” where the respondents may choose to list up to two joint owners. |
| Ethiopia Wave 1 (2011-12) | Sex of the certificate holder is based on the question “Who in the household can decide whether to sell this plot or use it as collateral?” where the respondent may choose to list up to two joint owners. |
| Ethiopia Wave 2-3 (2013-14, 2015-16) | Sex of the plot owner is based on the question “Who in the household can decide whether to sell this plot or use it as collateral?” where the respondent may choose to list up to two joint owners. |
| Nigeria Wave 1 (2010-11) | Sex of the plot owner is based on the question “Who is the owner of this plot?” where the respondent may only list one plot owner. This question is only asked for purchased plots, so we also use the gender of the individual(s) who have the right to sell or use plots as collateral for plots distributed by community or family. Respondents can identify up to three other household members with that right. |
| Nigeria Wave 2 (2012-13) | Sex of the plot owner is based on the question “Who is/are the owner(s) of this plot?” where the respondent may choose to list up to two joint owners. This question is only asked for purchased plots, so we use the gender of the individual(s) who have the right to sell or use plots as collateral for plots distributed by community of family. Respondents can identify up to three other household members with that right. |
| Nigeria Wave 3 (2015-16) | Sex of the plot owner is based on the question “Who is/are the owner(s) of this plot?” where the respondent may choose to list up to two joint owners. |
Poverty
We define poverty as daily consumption per person in the household below $1.25. This is adjusted for inflation and 2016 PPP implied exchange rate.
The World Bank has not released the consumption dataset for wave 3 of Nigeria.