Skip to content

Overview of Recent and Ongoing Projects by the Evans School Policy Analysis and Research Group on Climate Impact in Food Systems

Researchers at the Evans School Policy Analysis and Research Group (EPAR) engage in a wide range of projects spanning agriculture, development policy, financial services, poverty reduction, gender, and measurement and evaluation. Much of EPAR’s climate-related work is part of the newly established Center for Risk and Inclusion in Food Systems (CRIFS). CRIFS focuses on generating actionable, policy-driven insights to enhance the resilience of small-scale agricultural producers (SSPs) in low-income countries. Its research agenda addresses critical topics like climate adaptation, risk management, gender inclusion, and food system sustainability. By combining interdisciplinary methods and locally generated data, CRIFS supports innovative and cost-effective strategies to manage risks, reduce vulnerabilities, and improve livelihoods for SSPs.

Guided by CRIFS’s research agenda, EPAR researchers are leading several projects at various stages of development. These projects are consistent with the center’s commitment to interdisciplinary research and collaborative partnerships. Our focus is on male and female SSP adaptation to changes in risk; specifically, SSP uptake of technologies and practices intended to reduce vulnerability to climate change – within an agri-food system (AFS). Because our ultimate interest is impact at the farmer level, we must consider national policies and infrastructure that affect AFS, as well as more localized access, norms, agro-ecologies, and climate vulnerabilities.

This blog highlights a selection of ongoing work, including studies on the factors driving small-scale producers’ perceptions of climate risks, the role of behavioral and psychological factors in shaping production decisions, the ways climate change transforms consumer diets through its impacts on crops and prices, and the influence of climate and national policies on the resilience of agricultural value chains.

Farmer level decision-making

  • How risks shape and influence small-scale producer uptake of agricultural technologies and climate adaptation solutions: EPAR researchers, in collaboration with local partners, are developing risk profiles for small-scale producers (SSPs) in Nigeria and India to understand adaptation challenges to climate shocks, their costs, and how decisions vary by gender. Using a mixed-methods approach, including primary data and remote sensing data, they explore risk perceptions, access to climate information, and the impact of gender on technology adoption. Researchers expect to find a positive but imperfect correlation between self-reported and measured climate hazards and uncover how demographics and information influence adaptation decisions. These insights will inform targeted, context-specific interventions.
  • Farm-Level Agricultural Productivity and Adaptation to Extreme Heat: EPAR researcher Joaquín Mayorga and researchers from Arizona State University investigated the impact of extreme heat on farm-level agricultural productivity and adaptation strategies in Nigeria, using data from the Nigeria Living Standards Measurement Study (LSMS-ISA) from 2010, 2012, and 2015. While high temperatures reduce crop yields, findings show that farmers compensate by expanding cultivation areas and reallocating inputs, shifting from productivity boosting input such as fertilizers to protective measures like pesticides. High temperatures also increase reliance on hired labor and mixed-cropping practices. These results highlight the need for understanding farmer-level input substation and production choices especially for initiatives promoting specific inputs, as extreme heat may hinder their effectiveness.
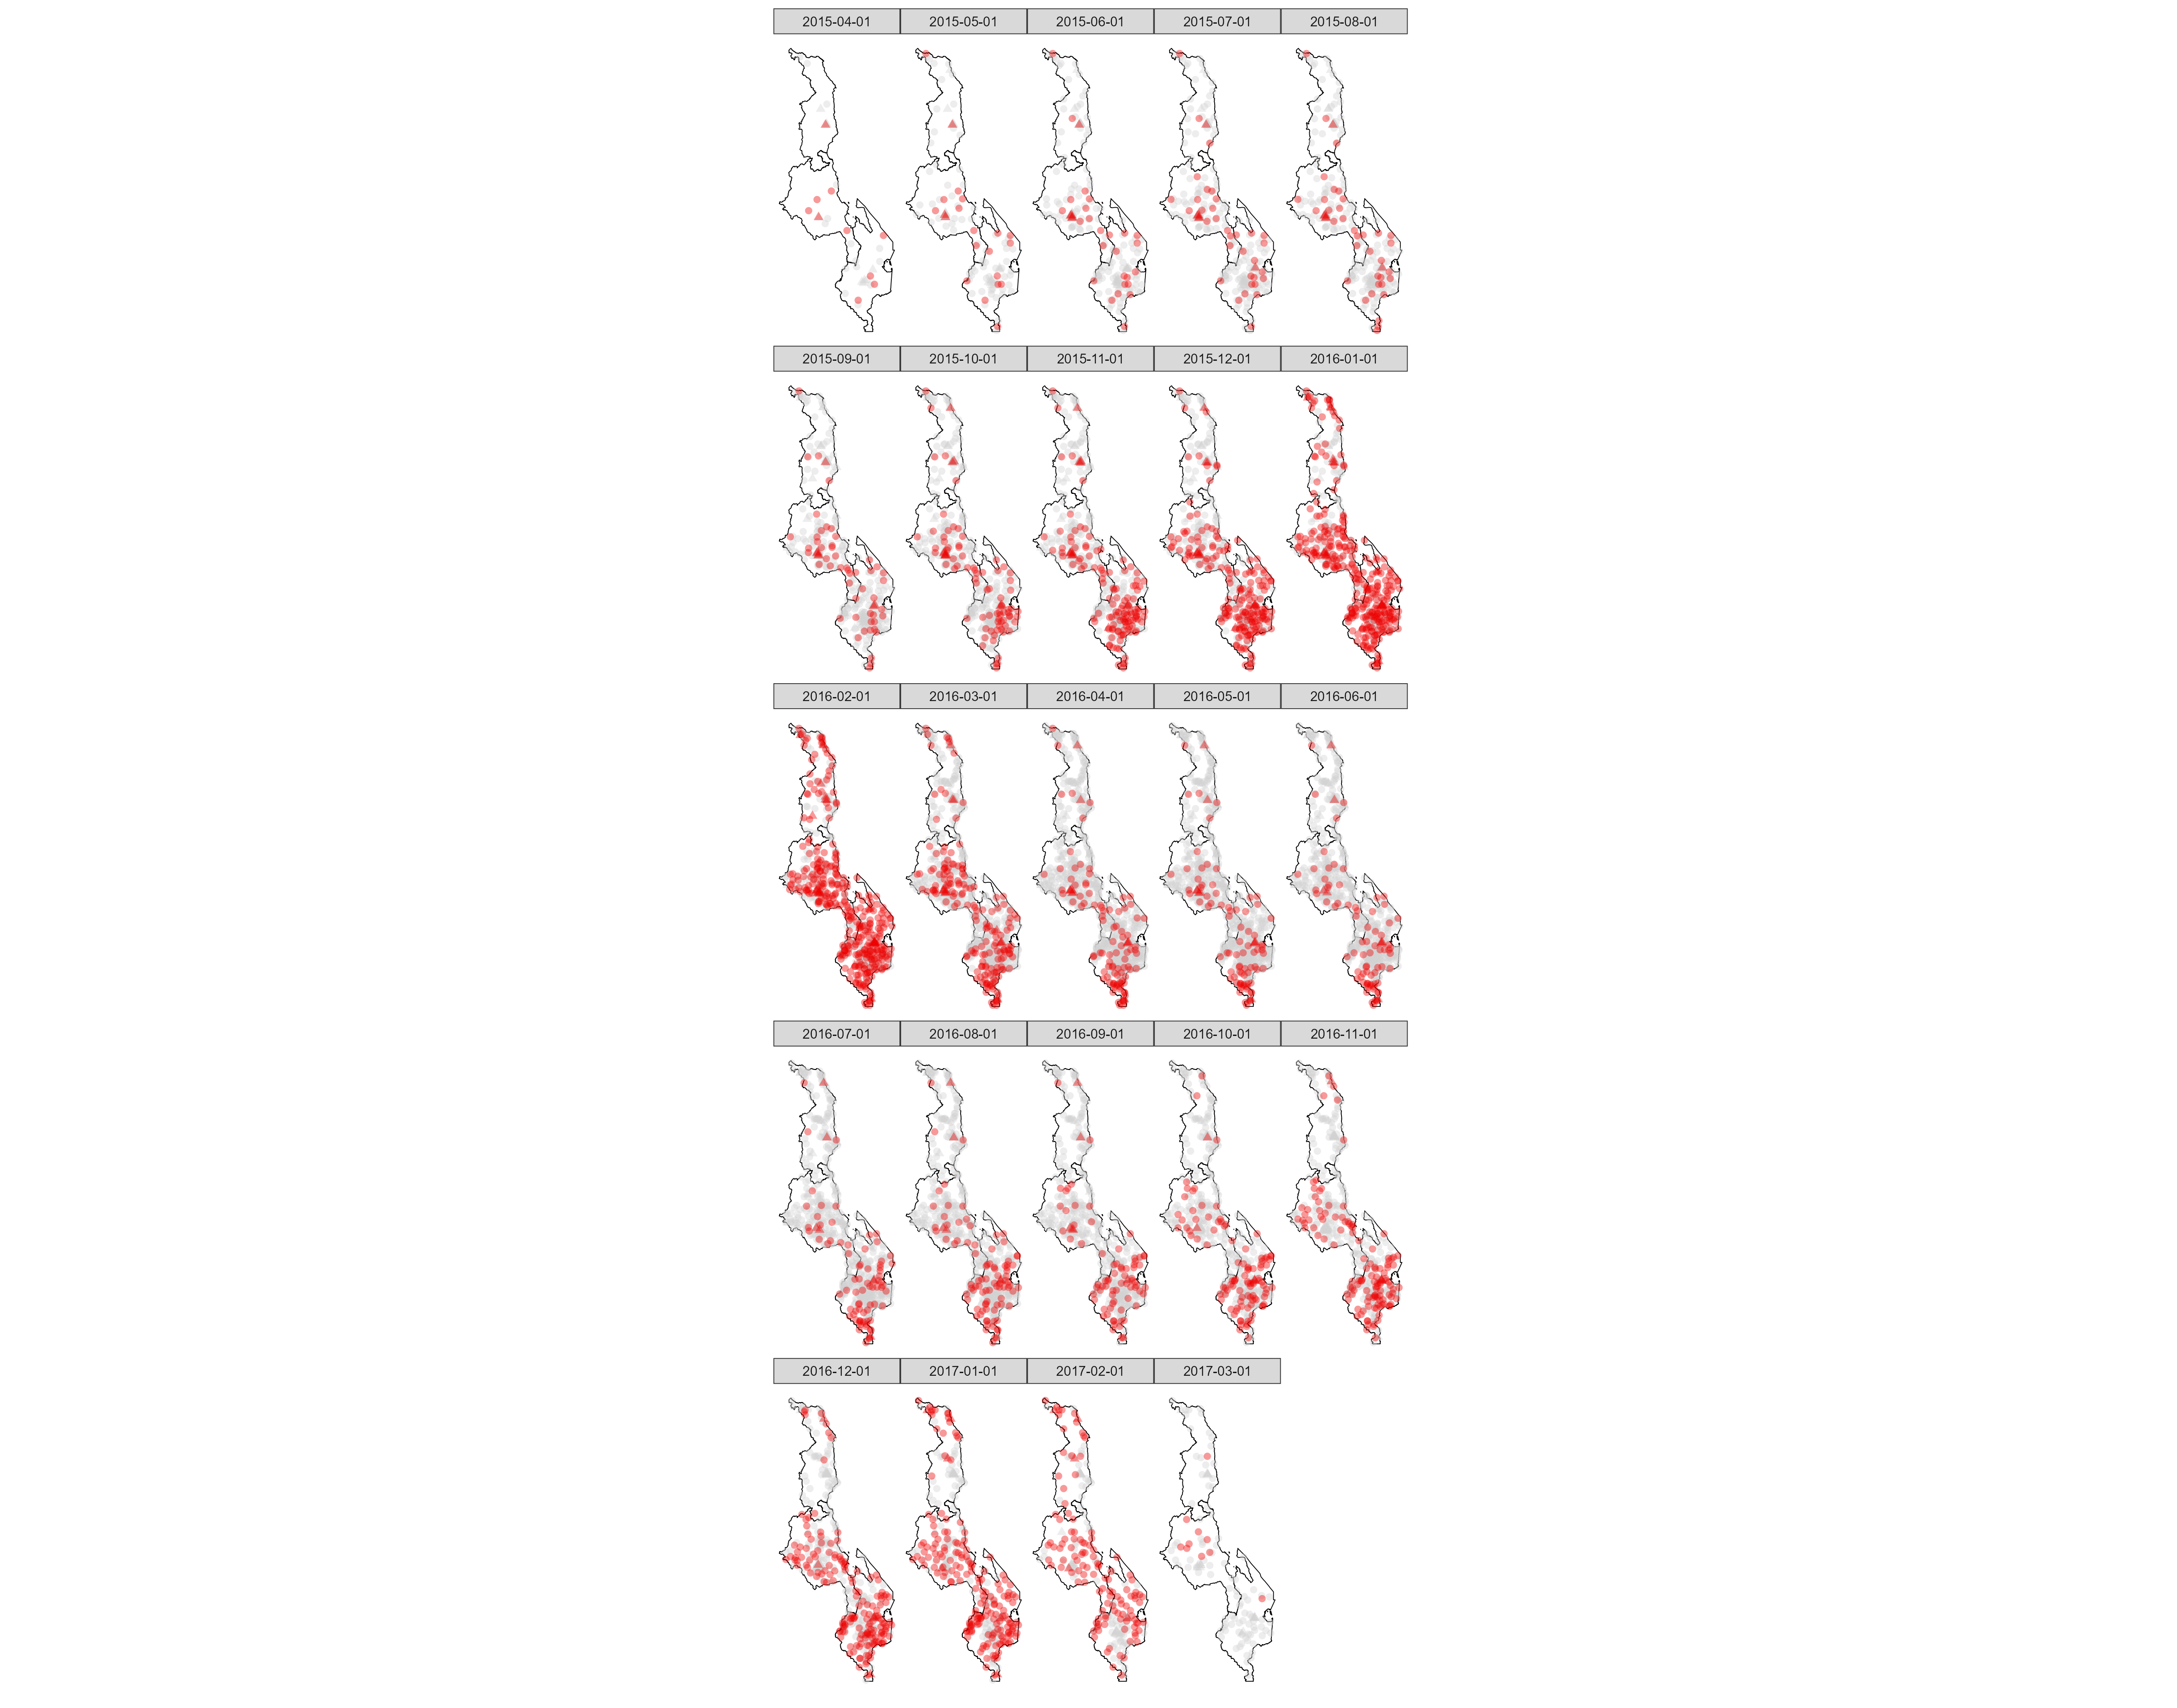
  • Comparing Self-Reported and Measured Climate Shocks: EPAR researchers analyze discrepancies between farmer-reported droughts and measured rainfall data in Ethiopia and Malawi. Using high-resolution satellite rainfall data and farming surveys, initial findings suggest that farmers are more likely to report droughts during growing seasons with low rainfall or prolonged dry spells. However, discrepancies exist, with false positives (reported droughts not reflected in data) and false negatives (missed actual droughts). Female-headed households in Ethiopia are more prone to false positives. These findings highlight the need to better understand how and why risk perceptions differ from measured risk, as an insight into SSP adaptation behaviors.  
Fig. 1: Comparison of surveyed community-level food insufficiency (top) and observed market maize prices (MWK/kg) in Malawi from 2009-2020.
Fig. 2: Spatial distribution of community-level food insufficiency from September 2015 to March 2017.

Broader Agri-Food System Dynamics

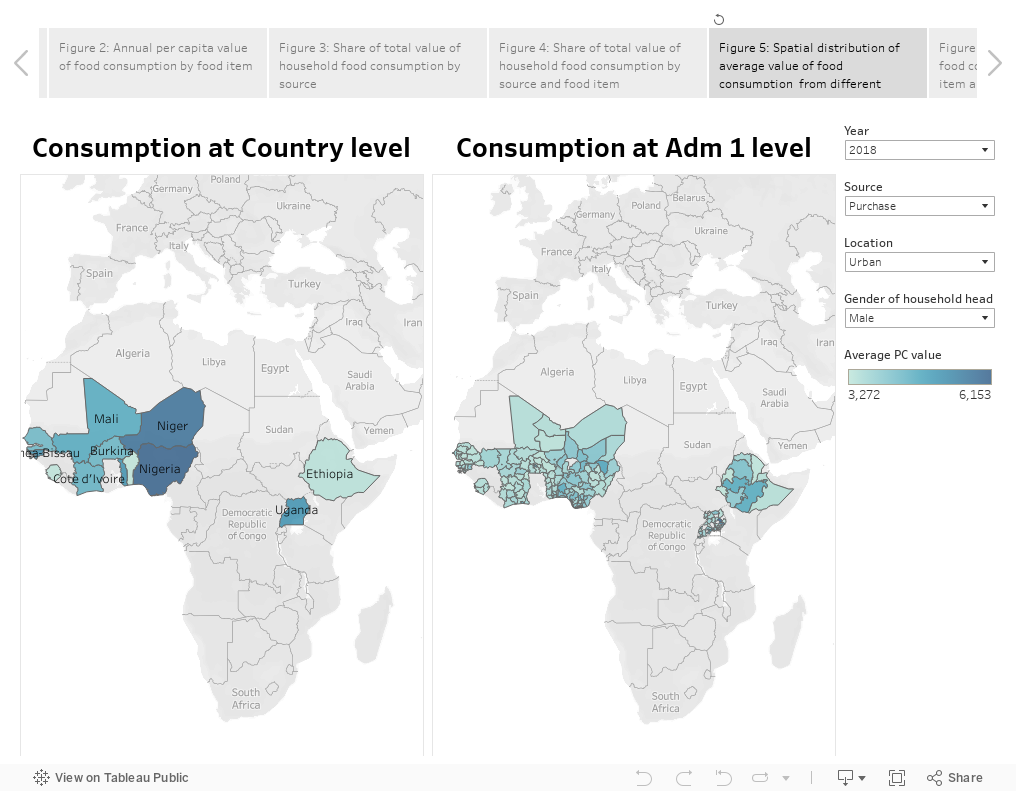
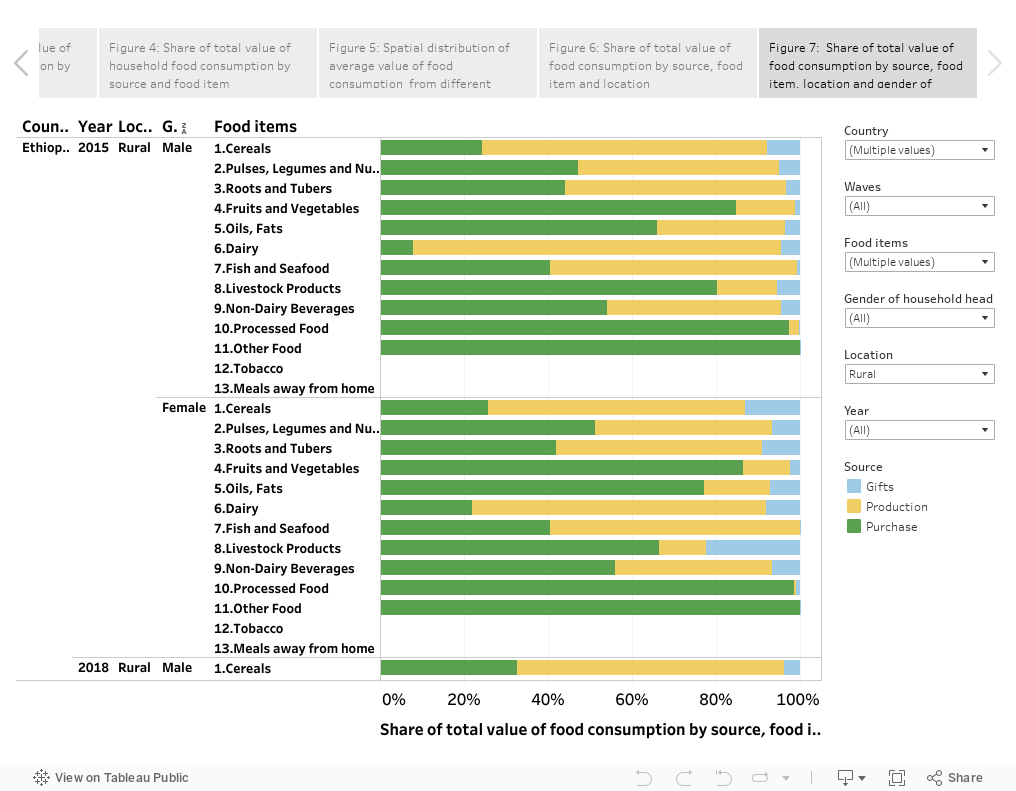
  • Climate shocks and changing diets in Sub-Saharan Africa: As more work continues to be done on the impacts of climate change, fewer studies focus on the climate-nutrition nexus. Leveraging a unique and extensive dataset (GitHub) on the patterns of food consumption (Figure) across 16 African countries over the period 2008-2021, EPAR researchers are assessing the impacts of climate shocks on diets. This study examines how climate stressors, such as temperature and rainfall shocks, are associated with the types of food consumed by households and the shift in the source of foods – own production versus market purchase. Initial analyses indicate that climate shocks influence food consumption differently across crop groups and sources. In areas where drought has become more prevalent, households consumed less cereals and legumes, and shifted their diets toward root and starchy tubers whose cultivation required less water. The analysis also shows that, across all locations – especially in rural areas – food purchase is increasing the dominant source of food acquisition as climate shocks reduced rural farmers productivity. This research highlights the role of alternative foods and food sources in agri-food systems, consumer’s responses to climate shocks, and the implications for nutrition security and food self-sufficiency.
Fig 3: Average annual evapotranspiration index, 2001-2021)
  • Resiliency of the rice sector in Nigeria in the context of a changing climate: Rice production in Nigeria has grown rapidly over the past few decades, becoming a staple food, particularly in peri-urban and urban areas. As part of its Agricultural Transformation Agenda (ATA), the Nigerian government aims to achieve rice self-sufficiency. However, the sector remains low in productivity and highly vulnerable to weather variability. In collaboration with researchers at the University of Arkansas, EPAR researchers are utilizing a global rice trade model and the latest climate change projections to analyze the Nigerian rice sector. This analysis assesses the potential impacts of climate change on yields, prices, and consumption. The model also evaluates various policy options to enhance small-scale rice producers’ productivity, increase milled rice production, and reduce dependency on imports. Initial findings suggest that climate change could sharply reduce domestic rice production by 2030, making self-sufficiency goals more challenging and increasing reliance on imports.

Patterns of household food consumption across food groups and sources in sub-Saharan African countries

Background

In most low- and middle-income countries (LMICs), per capita food expenditure has been steadily rising over the past few decades despite challenges from climate change, conflict, and COVID-19. Trends in food consumption are driven by urbanization, higher incomes, globalization, increased economic integration, and consumer preferences. In sub-Saharan Africa (SSA) there has been a shift away from the consumption of staple foods toward an increasingly diversified diet. Understanding these trends, however, remains constrained by the lack of large-scale cross-national data on the pattern of consumption across a broad set of food items. In particular, there is little information on cross-country and within-country variations in food consumption patterns and how households acquire food. Agricultural livelihoods dominate most LMICs, with many households’ food consumption coming predominantly from their own production. As economies transform and agriculture transitions from subsistence to commercial farming, it is expected that households will increasingly source food from markets. Increasing consumption from locally sourced production can incentivize investment in productive farm technologies and reduce import dependency, thereby contributing to food security. In this blog, we discuss an effort led by the University of Washington Evans School of Policy Analysis and Research (EPAR) group to standardize data on the value of food consumption patterns for a large number of food items and countries in SSA. We then leverage the data to discuss some insights regarding patterns of value of food consumption by food categories, food sources, and socio-demographics.

Standardizing food consumption indicators in large-scale household survey datasets

We leverage large-scale household datasets collected by the World Bank and country National Statistical Offices to construct food consumption indicators for 16 SSA countries over the period 2008-2021. These surveys ask households to report the amount of consumption from own-production and gifts, and the amount and value of food purchased over the past 7 days prior to the interview. Consumption from purchases comprises food items that are accessed from markets. Consumption from own production refers to consumed food items that are produced by households. Consumption from gifts encompasses food items households received from other households, non-governmental organizations, and the government. The value of food consumption from own production and gift was constructed using unit values estimated in reported quantities and values of purchases. For household food item observations for which no market purchase was reported, unit prices are imputed using the median purchase price of the same food items at the lowest administrative level with at least 10 observations. Food items were aggregated into broad categories: cereals, roots and tubers, pulses, legumes and nuts, dairy, fish and seafood, fruits and vegetables, livestock products, non-dairy beverages, oils and fats, processed food, other food, meals away from home, and tobacco. For comparability across countries, the monetary value of consumption was annualized and converted to 2017 Purchasing Power Parity (PPP).

Current patterns in average total value of food consumption at the aggregate level and by food items

Figure 1 presents a graph of the average annual per capita consumption in 2017 PPP for the most recent wave of data available for included countries. Nigeria had the highest average per capita value of food consumption in 2018, while Ethiopia had the lowest average per capita value of food consumption in 2021.

Figure 2 is an interactive graph allowing a user to select one or multiple countries or years and display the average per capita value of food consumption disaggregated by food items. One takeaway is that for most countries, cereals continue to be the main food item consumed, with the highest average per capita value of consumption in all countries except Benin, Cote d’Ivoire, and Uganda. The other top food item consumed in terms of monetary value is fruits and vegetables, except in Nigeria and Uganda. The least consumed food items are pulses and legumes and roots and tubers, with the exception of Uganda where oils/fats and non-dairy beverages are the least consumed food items. For countries with multiple years of data, we can examine trends in the per capita value of food consumption over time. We see, for example, a consistent increase in the value of consumption of cereals, pulses, legumes and nuts in Malawi and Mali.

Patterns in the value of food consumption by sources

Figure 3 presents the average annual share of the value of household food consumption from purchases, own production, and gifts. Across all countries and years, about 75% of household value of food consumption is from market purchases, while own production and gifts represent 20% and 5% respectively. There are substantial variations across countries and over time. Senegal had about 93% of its household value of food consumption acquired through purchases in 2018 while the lowest share was recorded in Uganda in 2011 (46%). For most countries, the relative importance of market-sourced food is growing. For example, in Uganda, the share of food from markets increased from, 46% in 2011 to 59% in 2019. Similar growth was observed in Ethiopia, Tanzania, and Niger.

Figure 4 presents an interactive graph showing the average share of the value of household food consumption from purchases, own production, and gifts, disaggregated by major food categories. It reveals that for most food categories, more than 60% of consumption comes from purchases. This is particularly true for high-value commodities such as fish and seafood, livestock products, fruits and vegetables, oils and fats, non-dairy beverages, and processed food. For staple crops such as cereals, pulses, and roots and tubers, the purchased share is lower. The consistency of shares by sources over time also varies; for example, Tanzania consistently had more than 50% of its dairy consumption from own production while in Malawi, less than 20% of dairy consumption come from own production. We see a gradual decrease in consumption of pulses, legumes, and nuts from own-production and a resulting increase in consumption from purchases and gifts. The share of roots and tubers increased for most of the waves in Tanzania while there was a consistent decrease in Nigeria.

Spatial and gender heterogeneity in the value of household food consumption

Figure 5 presents an interactive spatial distribution of the total value of food consumption from purchases, own production, and gifts at both country and administration one levels. The maps can be further disaggregated by year, location, and gender of household head. These maps show that countries in East Africa had a greater value of food consumption from their own production compared to other SSA countries. The estimates mapped can also be disaggregated by place of residence and the gender of the head of household to produce location- and gender-specific insights.  This insight holds for both male and female-headed households as well as households located in both rural and urban areas. This distinction is further strengthened when consumption is disaggregated by food items (see Figure 7).

Figure 6 explores differences in the share of the value of food consumption from different sources disaggregated by location. On average across countries, about 65% of food consumption for rural households comes from purchase. This percentage rises to about 90% for urban households in most countries, except Kenya and Uganda.

Figure 7 presents the same interactive graph as Figure 6 but is further disaggregated by the gender of the household head. Here, we see that for most countries, female-headed households (FHHs) residing in urban areas have a higher share of food consumption value from purchases compared to their counterparts in rural areas. The same distinction is also applicable for male-headed households (MHHs). The reverse is the case in Malawi where FHHs in both urban and rural areas have a lower share of food consumption value from purchases compared to MHHs. More generally, MHHs in both urban and rural areas tend to have a higher share of food consumption value from own production compared to FHHs.

Concluding remarks

This blog provides insights into the sources and patterns of the value of food consumption in SSA. It leverages a new dataset put together by EPAR processing and merging food consumption indicators in nationally representative large-scale household surveys collected in 16 SSA countries over the period 2008 – 2021. The analysis reveals that of the different sources of food examined, market-purchased consumption accounts for the highest value, even in rural areas. It also shows a rapid shift towards increased value of food consumption from purchases, marking a departure from traditional practices of consuming own-produced food and gifts. The analysis indicates that this shift is not uniform across countries and socio-demographic characteristics of households within countries. These shifts, rooted in socio-economic changes, gender roles, and urbanization, underscore the complex challenges and dynamics facing global food security and nutrition strategies. The dataset can be used to help understand changes in food sourcing and what this might mean for nutrition, resilience, and market access. The Stata codes to generate the dataset is available for download at the EPAR GitHub Repository. The more complete visualization data is also accessible on tableau visualization platform.

Blog written by Amaka Nnaji, Ahana Raina, Didier Alia and C. Leigh Anderson.