Researchers at the Evans School Policy Analysis and Research Group (EPAR) engage in a wide range of projects spanning agriculture, development policy, financial services, poverty reduction, gender, and measurement and evaluation. Much of EPAR’s climate-related work is part of the newly established Center for Risk and Inclusion in Food Systems (CRIFS). CRIFS focuses on generating actionable, policy-driven insights to enhance the resilience of small-scale agricultural producers (SSPs) in low-income countries. Its research agenda addresses critical topics like climate adaptation, risk management, gender inclusion, and food system sustainability. By combining interdisciplinary methods and locally generated data, CRIFS supports innovative and cost-effective strategies to manage risks, reduce vulnerabilities, and improve livelihoods for SSPs.
Guided by CRIFS’s research agenda, EPAR researchers are leading several projects at various stages of development. These projects are consistent with the center’s commitment to interdisciplinary research and collaborative partnerships. Our focus is on male and female SSP adaptation to changes in risk; specifically, SSP uptake of technologies and practices intended to reduce vulnerability to climate change – within an agri-food system (AFS). Because our ultimate interest is impact at the farmer level, we must consider national policies and infrastructure that affect AFS, as well as more localized access, norms, agro-ecologies, and climate vulnerabilities.
This blog highlights a selection of ongoing work, including studies on the factors driving small-scale producers’ perceptions of climate risks, the role of behavioral and psychological factors in shaping production decisions, the ways climate change transforms consumer diets through its impacts on crops and prices, and the influence of climate and national policies on the resilience of agricultural value chains.
Farmer level decision-making
- How risks shape and influence small-scale producer uptake of agricultural technologies and climate adaptation solutions: EPAR researchers, in collaboration with local partners, are developing risk profiles for small-scale producers (SSPs) in Nigeria and India to understand adaptation challenges to climate shocks, their costs, and how decisions vary by gender. Using a mixed-methods approach, including primary data and remote sensing data, they explore risk perceptions, access to climate information, and the impact of gender on technology adoption. Researchers expect to find a positive but imperfect correlation between self-reported and measured climate hazards and uncover how demographics and information influence adaptation decisions. These insights will inform targeted, context-specific interventions.
- Farm-Level Agricultural Productivity and Adaptation to Extreme Heat: EPAR researcher Joaquín Mayorga and researchers from Arizona State University investigated the impact of extreme heat on farm-level agricultural productivity and adaptation strategies in Nigeria, using data from the Nigeria Living Standards Measurement Study (LSMS-ISA) from 2010, 2012, and 2015. While high temperatures reduce crop yields, findings show that farmers compensate by expanding cultivation areas and reallocating inputs, shifting from productivity boosting input such as fertilizers to protective measures like pesticides. High temperatures also increase reliance on hired labor and mixed-cropping practices. These results highlight the need for understanding farmer-level input substation and production choices especially for initiatives promoting specific inputs, as extreme heat may hinder their effectiveness.
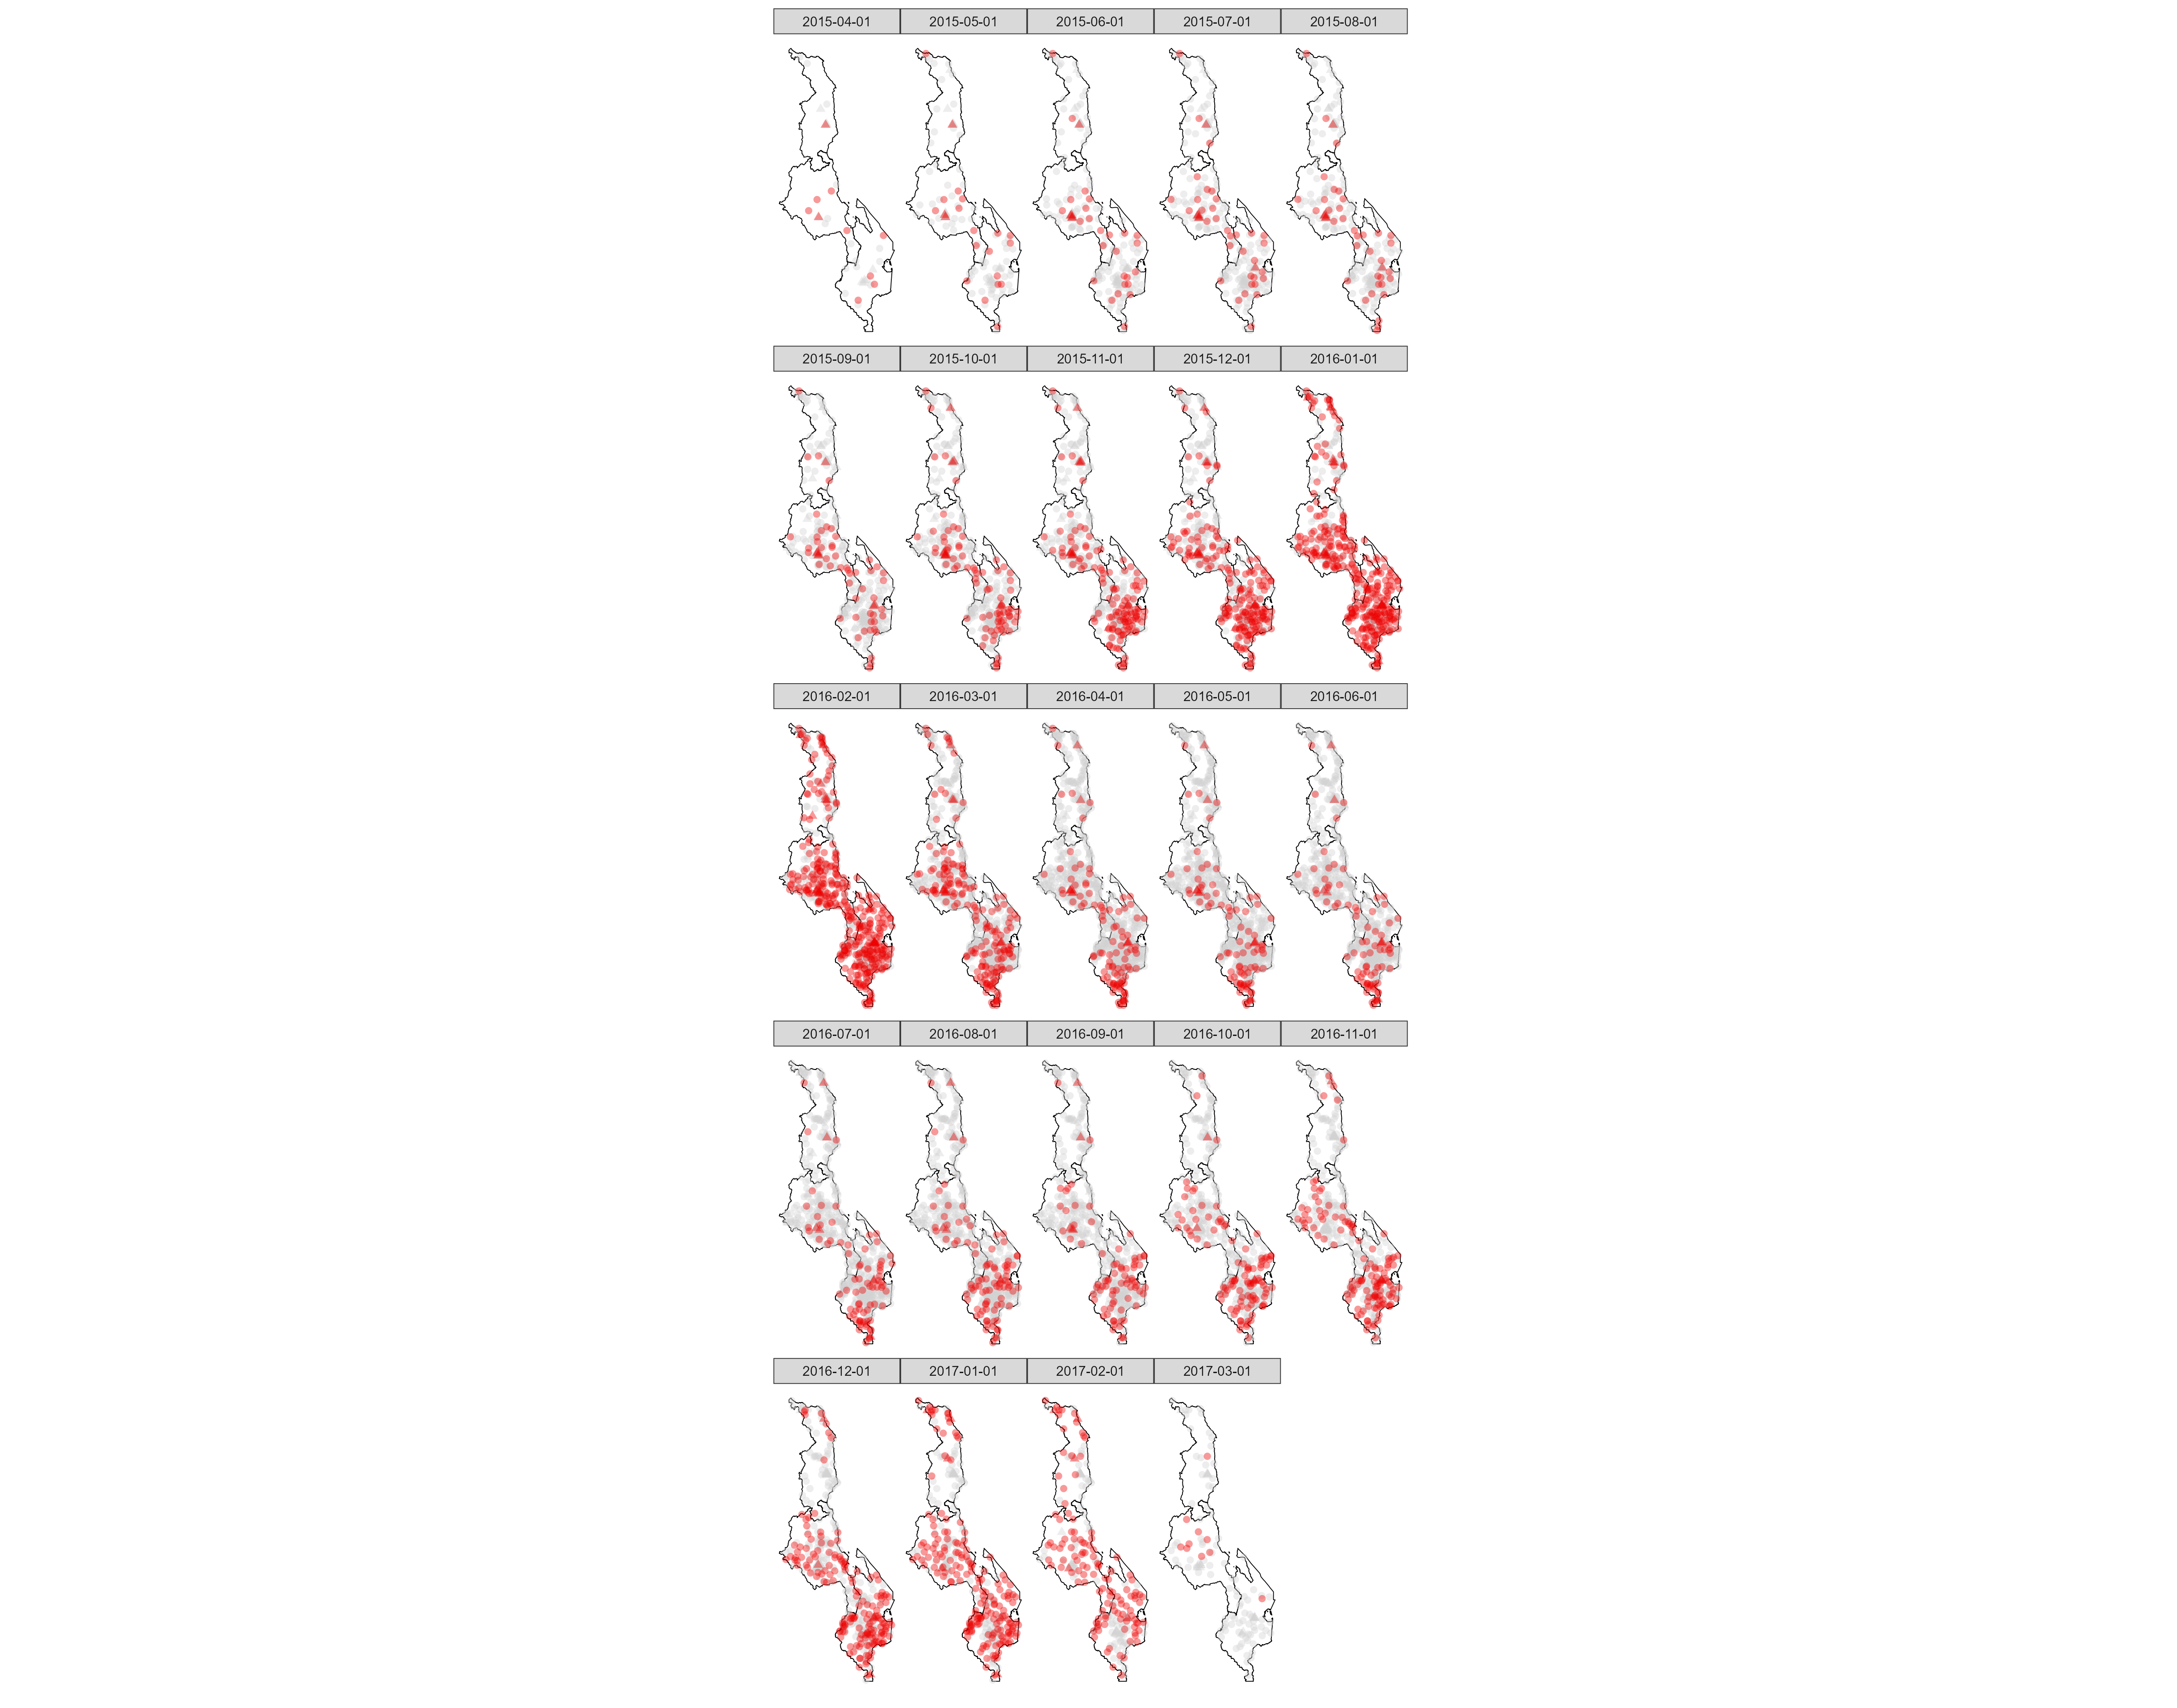
- Comparing Self-Reported and Measured Climate Shocks: EPAR researchers analyze discrepancies between farmer-reported droughts and measured rainfall data in Ethiopia and Malawi. Using high-resolution satellite rainfall data and farming surveys, initial findings suggest that farmers are more likely to report droughts during growing seasons with low rainfall or prolonged dry spells. However, discrepancies exist, with false positives (reported droughts not reflected in data) and false negatives (missed actual droughts). Female-headed households in Ethiopia are more prone to false positives. These findings highlight the need to better understand how and why risk perceptions differ from measured risk, as an insight into SSP adaptation behaviors.

Broader Agri-Food System Dynamics
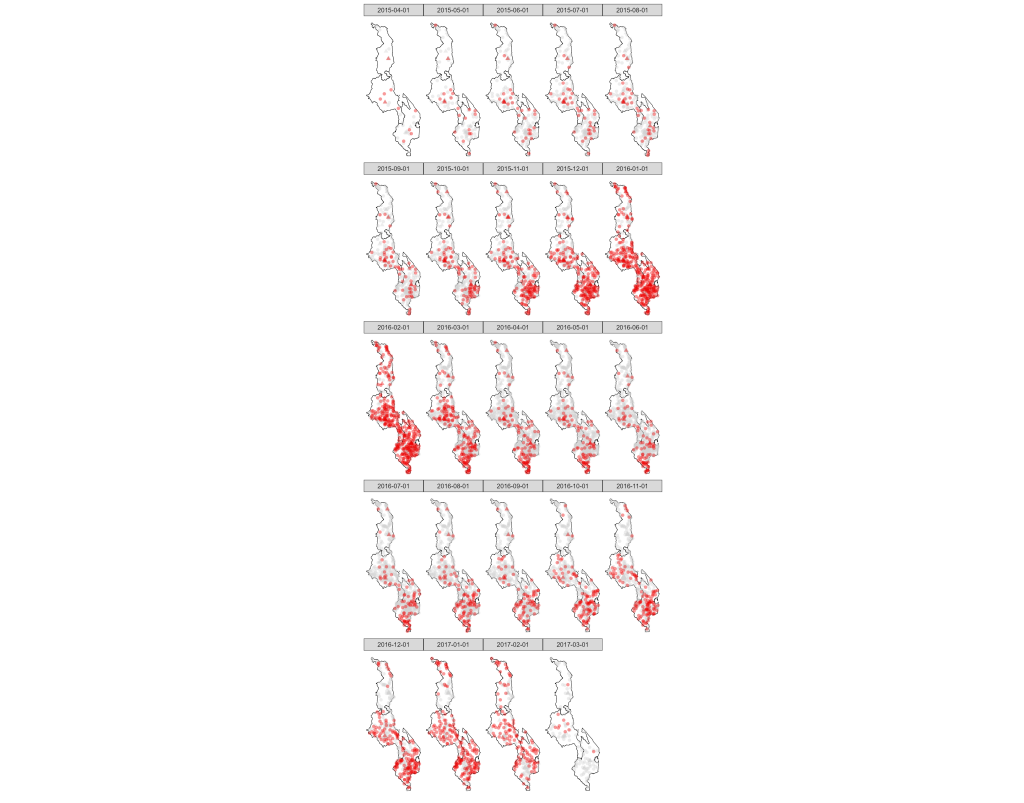
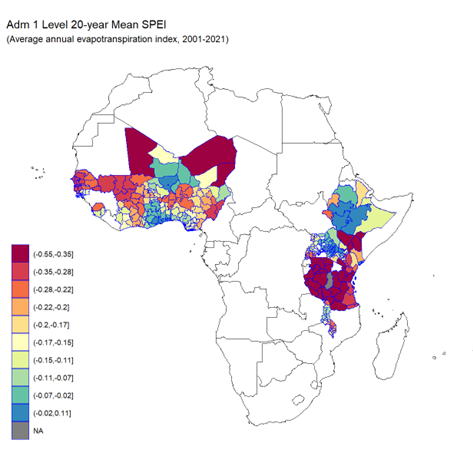
- Climate shocks and changing diets in Sub-Saharan Africa: As more work continues to be done on the impacts of climate change, fewer studies focus on the climate-nutrition nexus. Leveraging a unique and extensive dataset (GitHub) on the patterns of food consumption (Figure) across 16 African countries over the period 2008-2021, EPAR researchers are assessing the impacts of climate shocks on diets. This study examines how climate stressors, such as temperature and rainfall shocks, are associated with the types of food consumed by households and the shift in the source of foods – own production versus market purchase. Initial analyses indicate that climate shocks influence food consumption differently across crop groups and sources. In areas where drought has become more prevalent, households consumed less cereals and legumes, and shifted their diets toward root and starchy tubers whose cultivation required less water. The analysis also shows that, across all locations – especially in rural areas – food purchase is increasing the dominant source of food acquisition as climate shocks reduced rural farmers productivity. This research highlights the role of alternative foods and food sources in agri-food systems, consumer’s responses to climate shocks, and the implications for nutrition security and food self-sufficiency.
- Resiliency of the rice sector in Nigeria in the context of a changing climate: Rice production in Nigeria has grown rapidly over the past few decades, becoming a staple food, particularly in peri-urban and urban areas. As part of its Agricultural Transformation Agenda (ATA), the Nigerian government aims to achieve rice self-sufficiency. However, the sector remains low in productivity and highly vulnerable to weather variability. In collaboration with researchers at the University of Arkansas, EPAR researchers are utilizing a global rice trade model and the latest climate change projections to analyze the Nigerian rice sector. This analysis assesses the potential impacts of climate change on yields, prices, and consumption. The model also evaluates various policy options to enhance small-scale rice producers’ productivity, increase milled rice production, and reduce dependency on imports. Initial findings suggest that climate change could sharply reduce domestic rice production by 2030, making self-sufficiency goals more challenging and increasing reliance on imports.
