Introduction
Nitrogen is a key driver of soil fertility, but many (SSPs) face depleted soils and high synthetic nitrogen fertilizer costs. Biological nitrogen fixation enables soil bacteria living in legume nodules to convert atmospheric nitrogen into plant-available forms, reducing reliance on synthetic inputs. Inoculation with symbiotic nitrogen-fixing bacteria (primarily Rhizobium and Bradyrhizobium spp.) is now a core component of legume agronomy, particularly where compatible indigenous rhizobia are scarce or absent. These inoculants contain live nitrogen-fixing bacteria that can be applied to seed or soil at planting, to raise yields and protein content while improving soil fertility.
Commercial investment has largely centered on soybean (Glycine max), making soybean-specific inoculants both widely available and relatively well adopted across sub-Saharan Africa, where imported or locally produced Bradyrhizobium japonicum strains have been extensively tested. However, inoculant availability and uptake remain low for other key legumes – cowpea (Vigna unguiculata), groundnut (Arachis hypogaea), and common bean (Phaseolus vulgaris) – despite multiple field trials documenting promising yield gains.
To understand this gap, this work reviews evidence from Africa and a set of comparative studies from Brazil, where approximately 80% of soybean area is inoculated, and a dedicated regulatory framework for microbial inputs has been in place since the 1970s. Our objective was to identify barriers to non-soybean inoculant uptake across the value chain – and to highlight data and policy priorities for integrating these technologies into SSP crop systems.
Study Scope and Approach
The desk review focuses on non-soybean legume inoculants in two African subregions:
- West Africa: cowpea and groundnut in Ghana, Nigeria, Senegal.
- East Africa: common bean in Ethiopia, Kenya, Tanzania, Uganda.
We found that across these geographies, non-soybean inoculant use remains rare, even though post-2015 literature documents mostly positive results across 31 field trials, a portfolio of 22 commercial products from 15 manufacturers, and emerging regulatory frameworks. Three workstreams structured our analysis.
- A post-2015 literature review synthesized evidence on (i) how inoculant market
’s function and commercialize new products, (ii) farmer awareness, demand, and adoption decisions, and (iii) biological compatibility between specific rhizobia strains and the target legumes. - A product inventory of 22 commercial inoculants from 15 manufacturers, recording (where disclosed) the strain used, carrier type, labeled crops, and countries in which each product is marketed.
- A policy and standards review bringing together national and regional rules, standards, and guidelines that govern how inoculants are registered, tested for quality, labeled, and monitored once on the market.
- A focused review on Brazil, where agencies such as MAPA, CTNBio, ANVISA, and EMBRAPA jointly oversee inoculant R&D, registration, and market supervision. Brazilian strains such as Bradyrhizobium BR 3267 illustrate how locally adapted strains can move from discovery through multi-location testing to commercial registration, a pathway that is only partially and unevenly replicated in African contexts.
Across regions, the evidence base is constrained by limited primary data: few farmer surveys, sparse market diagnostics, and scattered quality assessments. Many of the results reported here therefore come from secondary syntheses that pool findings across crops and countries. While this synthesis is important for assessing whether there is any meaningful market signal for rhizobia inoculants, it needs to be complemented by more disaggregated surveys and value-chain research to recover the heterogeneity that matters for product design and targeting.
Inventory of Commercial Rhizobia Inoculant Products
Across the 22 products, 15 different manufacturers are represented, but just six inoculants are explicitly marketed for cowpea, groundnut, or common bean in the focal East African countries, which is fewer than one-third of documented inoculants. Even these six non-soybean products often list multiple legume species on the label, rather than being tailored and tested for a single crop-strain combination.
Researchers found that the bacterial strain disclosure was incomplete: some products identify well-known commercial strains (for example, specific Bradyrhizobium japonicum lines), while others list only generic Rhizobium spp. or proprietary names, making it difficult to link them back to published field trials or to native strains tested in African soils. Geographical coverage is also uneven. A few brands are marketed across multiple countries, but many appear confined to a single national market or to online platforms with unclear physical distribution. Taken together, farmers growing non-soybean legumes face a very thin set of locally validated, transparently labeled options.
Systems-Level Barriers to Commercialization
Most of the 22 products are peat-based seed treatments containing Rhizobium or Bradyrhizobium cells that are mixed with seed before sowing, with a smaller number formulated as liquids or other carrier types for either on-seed or in-furrow application. Only a subset are explicitly marketed for cowpea, groundnut, or common bean, often with partially specified or proprietary strain names, reflecting heterogeneity in strain transparency, delivery technology, and crop targeting across the portfolio.
Delivery System Weaknesses
The African inoculant supply chain is constrained by limited manufacturing capacity and fragile delivery systems. Peat-based and lyophilized products typically have shelf-lives ranging from two to six months and often require cold or at least cool storage to maintain viable cell counts. In the focal countries, cold chain infrastructure is sparse and uneven, particularly beyond major urban centers, creating high risk of viability loss between factor and farm gate. Based on the literature, quality testing reveals contamination, unsterilized carriers, or low viable counts in some products
Market and Industrial Constraints
Demand for non-soybean inoculants remains thin, reducing incentives for firms to invest in formulation refinement, distribution networks, and farmer-facing marketing. On the R&D side, public research institutions remain dominated by imported strains designed for soybeans or non-African conditions.
The result is a fragmented product landscape: many commercial products are labeled with broad crop ranges but lack crop and site-specific performance data for cowpea, groundnut, or common bean in African conditions. Proprietary blend labels that obscure strain identity further amplify information asymmetries and complicate efforts to synthesize performance evidence.
Brazil offers a contrast: mandatory strain identification, efficacy testing, routine quality control, and publicly maintained strain banks (e.g., EMBRAPA collections) help align commercial products with field-tested performance. However, most African commercialization evidence stems from secondary reviews rather than systematic industry surveys. Value-chain specific research is needed to quantify losses in quality along the chain, map incentives faced by different firm types, and test which regulatory or financial instruments would strengthen supply.
Farmer Demand and Adoption Barriers
Awareness and Information
A pervasive barrier is lack of awareness of non-soybean inoculants among SSPs. Only a handful of studies (two farmer surveys and one agri-dealer survey) directly measure knowledge or adoption intentions for cowpea, groundnut, or common bean inoculants, and these report very low familiarity relative to soybean products. Extension programs, field demonstrations, and input dealer outreach that promote soybean inoculants have rarely been systematically extended to these other crops.
Affordability and Perceived Cost-Effectiveness
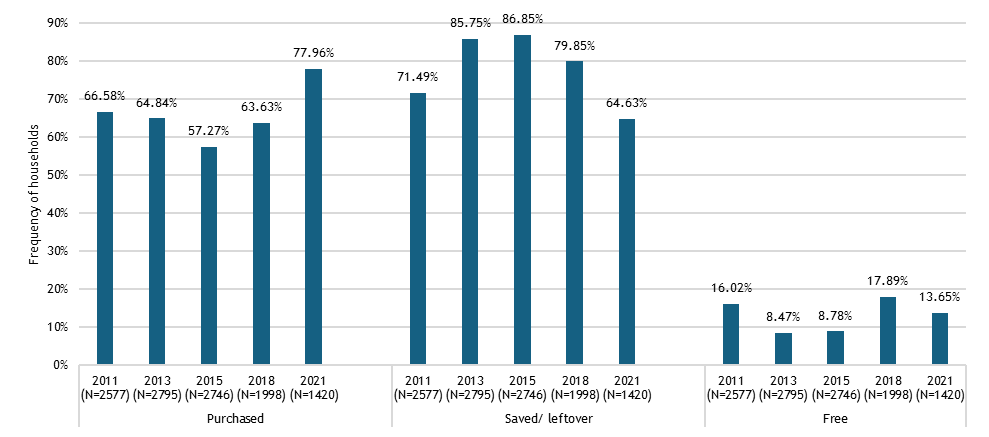
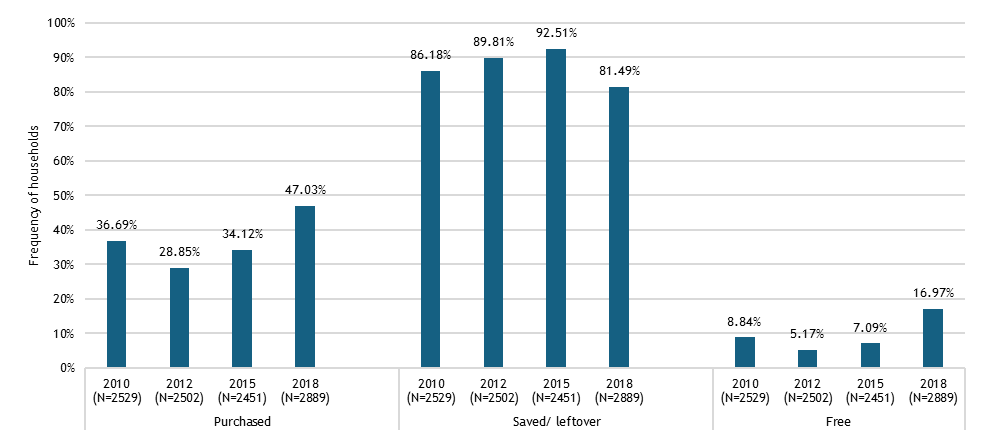
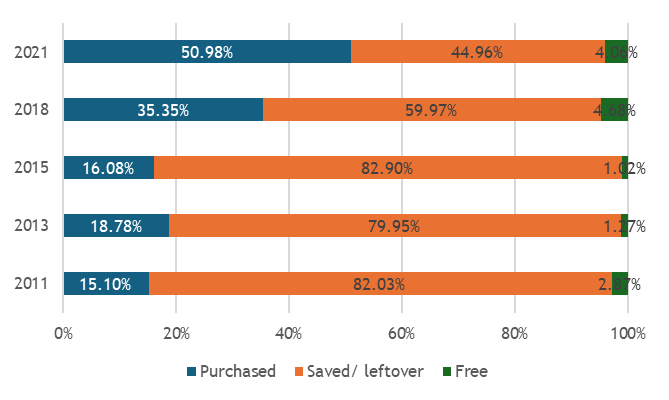
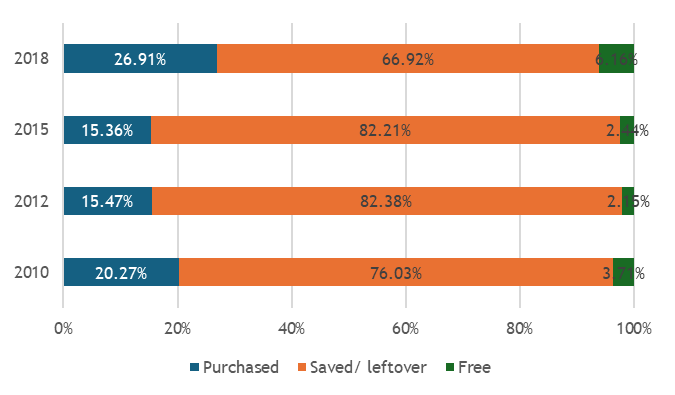
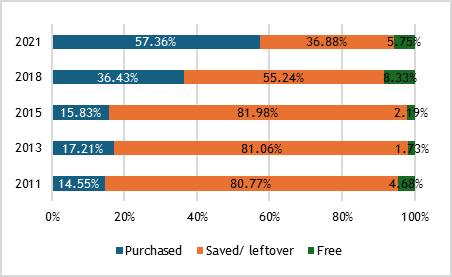
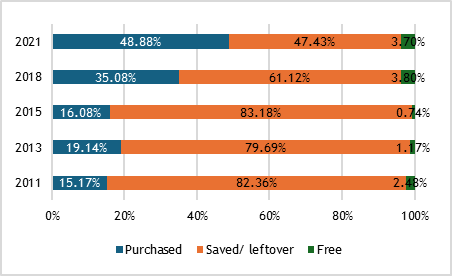
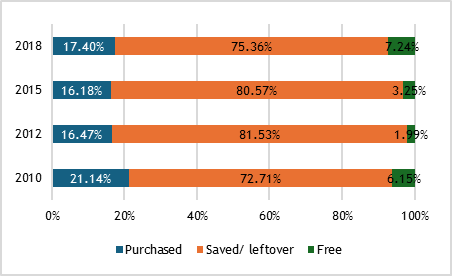
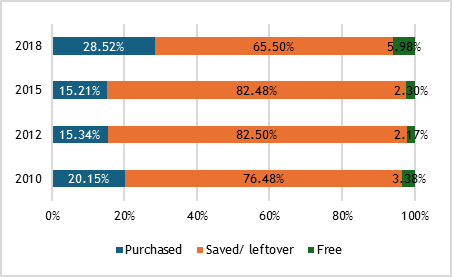
Evidence on affordability is mixed. Some reviews and small-scale surveys identify price and liquidity constraints as major barriers, especially where inoculants must be purchased with cash at planting time and credit is limited. Other analyses note that, in principle, inoculants can be substantially cheaper per hectare than synthetic nitrogen – on the order of the one-twentieth the cost of urea in some settings – making them highly cost-effective if yield responses are reliably realized. At the same time, inorganic nitrogen offers consistently visible yield effects, requires no cold chain, and simple applications, so its perceived value may remain higher for many farmers even when inoculants are nominally cheaper. Because almost no systematically collected retail price data exist, it remains difficult to disentangle the roles of cost, reliability, and availability.
Trust, Product Quality and Availability
Farmer and dealer trust can be undermined by inconsistent product performance. Contamination, poor storage, or expired stocks lead to weak or no yield response, and word-of-mouth can rapidly erode confidence in the entire product category. Limited recourse mechanisms exacerbate this. Availability is also inconsistent: suitable products may be sold only in a subset of regions, or exclusively through higher-tier agro-dealers, making access difficult for remote or poorer farmers.
Brazil again offers a contrast: public extension, private company outreach, and clear regulatory standards have, over time, supported farmer confidence in product labeling and performance. While misapplication and context-specific failures still occur, routine quality surveillance and the possibility of sanctions against non-compliant firms provide a credible baseline of reliability.
Most empirical research on demand measures only stated intentions, with little evidence on repeated on-farm use. There is little segmentation by gender, wealth, farm size, or degree of market orientation.
R&D and Compatibility
Field Trial Results
Across 31 trials reviewed, most report at least one site with positive yield responses, often substantial, relative to uninoculated controls. Local strains frequently outperform imported or generic commercial strains. According to the literature, effects are highly site-specific: the same strain-crop combination can generate strong gains in one agroecological zone and negligible or inconsistent responses in another, even within the same country.
Divergent Narratives
In contrast to generally positive trial-level evidence, review papers often emphasize persistent compatibility challenges and failed inoculations. Many field trials compare carefully prepared inoculants based on locally isolated strains, produced and stored under controlled conditions, against off-the-shelf commercial products that are substantially more exposed to quality-control failures and suboptimal handling. Nearly all trials are also researcher-managed or closely supervised, with optimized seed handling, accurate dosing, and at least moderate soil fertility, whereas in farmers’ fields delayed planting, poor mixing, co-application with incompatible chemicals, and degraded soils are common. The implication is that ‘compatibility’ is best understood as a property of the whole system – strain, host, soil conditions, product quality, and farmer practice – rather than of the strain-host pair in isolation.
Brazil illustrates a structured pipeline from strain discovery to product: strains undergo multi-location testing, and those that pass efficacy and stability criteria enter public collections and become candidates for registration and commercial formulation. In the African context, by contrast, linkages between experimental strains, product registration, and marketed formulations remain weak, and few products used by farmers can be directly traced back to well-documented trial results. Building analogous, if smaller-scale, institutional pipelines in Africa may be as important as discovering new strains.
Regulatory Environment
All focal African countries have some microbial inputs regulation, but these vary widely in scope and specificity; some treat inoculants as distinct products, while others subsume them under general fertilizer rules. Responsibilities for registration, quality control, and enforcement are frequently split across multiple agencies, creating potential coordination challenges. Evidence on actual enforcement is limited: documented cases of routine market surveillance, random sampling, and public compliance reporting are rare, whereas anecdotal accounts of contaminated or ineffective products are relatively common.
Brazil’s system, which combines mandatory registration, accredited laboratories, and penalties for non-compliance, illustrates how de jure rules can be translated into de facto quality assurance over time. Experiences from Brazil suggest that similar gains in other regions would require not only legal frameworks, but also investments in regulatory capacity, laboratory infrastructure, and transparent data systems tailored to local institutional and market conditions.
Conclusion Inoculation with Rhizobium spp. is a well-established agricultural practice, especially in areas outside of soybean’s native range, where compatible indigenous microbiota may be scarce. Soybean’s global reach, substantial commercial importance, and long history of lab and field research have likely facilitated soybean inoculant products’ establishment in sub-Saharan Africa. Delivery systems also constrain adoption: peat-based carriers dominate but are susceptible to desiccation, heat damage, and contamination where cold chains and storage are weak. Liquid and hydrogel-based formulations offer potentially superior moisture retention and microbial survival, and may extend shelf-life under tropical conditions, but have not yet been extensively tested for non-soybean legumes in African on-farm trials. Despite the success of research-scale field trials, those benefits have not yet reached most farmers, and anecdotal reports suggest that the absence of consistent quality control standards and a lack of well-developed commercial channels may represent upstream hurdles to adoption. Brazil’s experience – where a large-scale, commercially oriented soybean sector operates under a relatively mature and well-enforced inoculant regulatory system – offers useful lessons on how coordinated R&D, regulation, and industry can support product quality and uptake, but any attempt to translate those lessons to sub-Saharan Africa will need to account for smaller average farm size, more heterogeneous markets, and greater cultural, linguistic, and legislative diversity.
Blog written by Shreyaa Lakshmi Narayanan.