CRIFS TECHNICAL BRIEF 396c
Risks in Food Systems: Understanding how Risk Affects Small-Scale Producer’s Decision-making

Sat, 05/23/2026
AUTHORS: Joaquin Mayorga, C. Leigh Anderson, Didier Y. Alia
Key messages
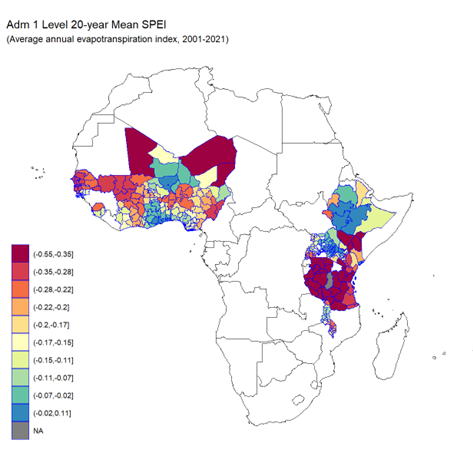
- The Intergovernmental Panel on Climate Change (IPCC) as “the potential for adverse consequences for human or ecological systems”. In food systems, risks emerge from the interaction of climatic, economic, and institutional hazards with differential exposure and vulnerability across actors.
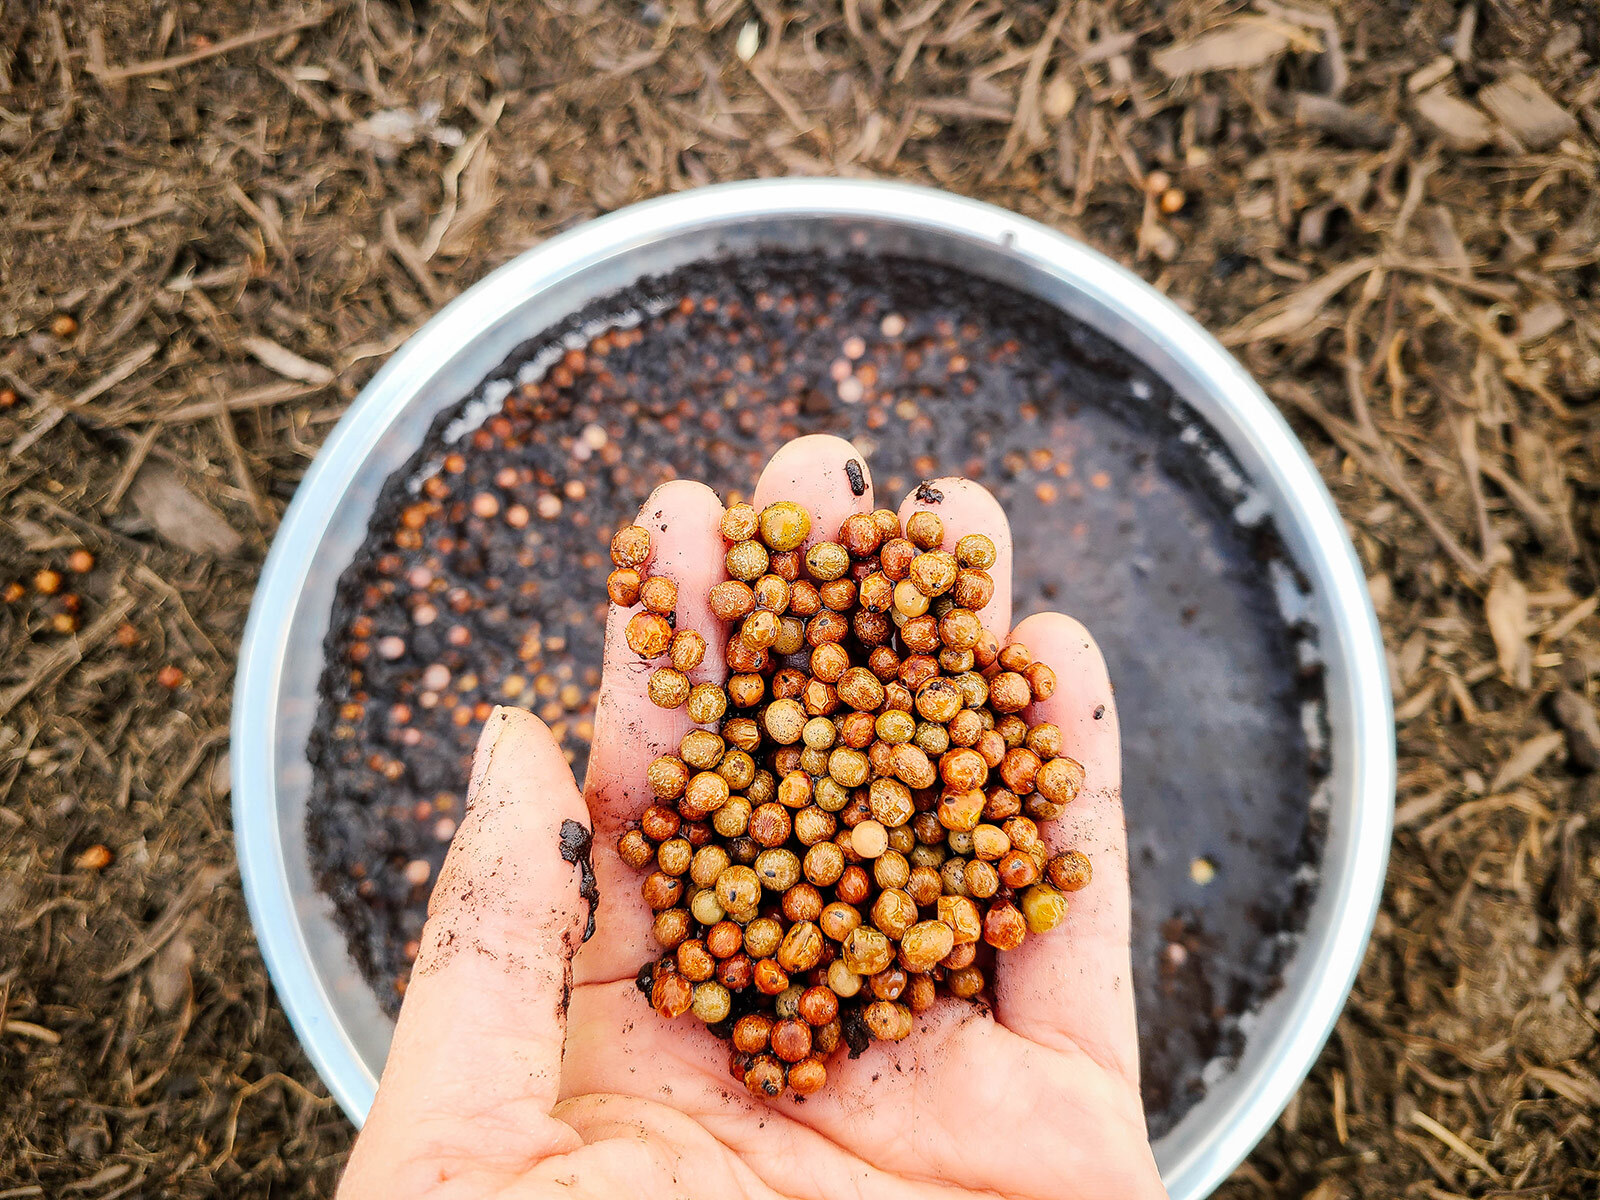
- Small-scale producers (SSPs), as key actors in food systems, face multiple risks. They make farming decisions based on how they perceive these risks, shaped by their own risk tolerance and assessment of dread, familiarity, and other characteristics of the hazard, and that can diverge from actuarial risk.
- This technical brief discusses SSP decision-making in food systems, in the context of IPCC defined risk, and illustrates how risk perceptions and risk attitudes are integrated into CRIFS’ research agenda on SSP technology adoption.
RESEARCH TOPIC CATEGORY: Sustainable Agriculture & Rural Livelihoods
GEOGRAPHIC FOCUS: Sub-Saharan Africa; South Asia
Downloadable Documents
Research Brief