EPAR TECHNICAL REPORT #356
Tue, 10/31/2017
AUTHORS: Pierre Biscaye; C. Leigh Anderson; Travis Reynolds

ABSTRACT:
According to AGRA’s 2017 Africa Agriculture Status Report, smallholder farmers make up to about 70% of the population in Africa. The report finds that 500 million smallholder farms around the world provide livelihoods for more than 2 billion people and produce about 80% of the food in sub-Saharan Africa and Asia. Many development interventions and policies therefore target smallholder farm households with the goals of increasing their productivity and promoting agricultural transformation. Of particular interest for agricultural transformation is the degree to which smallholder farm households are commercializating their agricultural outputs, and diversifying their income sources away from agriculture. In this project, EPAR uses data from the World Bank’s Living Standards Measurement Study – Integrated Surveys on Agriculture (LSMS-ISA) to analyze and compare characteristics of smallholder farm households at different levels of crop commercialization and reliance on farm income, and to evaluate implications of using different criteria for defining “smallholder” households for conclusions on trends in agricultural transformation for those households.
As a contribution to the 2017 AGRA Africa Agriculture Status Report report, EPAR used data from the Tanzania National Panel Survey (TNPS) and Ethiopia Socioeconomic Survey (ESS), both part of the LSMS-ISA, to categorize smallholder farmers based on the share of their crop production value that they sold and the share of non-farm income in total household income, following a typology introduced by Peter Hazell. EPAR’s initial estimates of the shares of smallholder households (those with farm area greater than 0 but less than 4 ha) are included in Chapter 1 of the AGRA report, and the methods for the analysis are described in Annex 1. The typology is represented in the figure below.
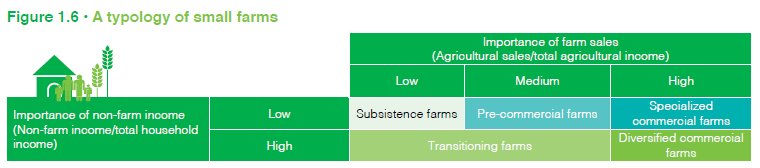
Source: Peter Hazel, 2017 Africa Agriculture Status Report
An interactive data visualization presents this typology of farm households with updated estimates from the TNPS and ESS. The visualization allows viewers to select various sub-populations of households and explore differences in shares of households in each category and in the characteristics of the households.
The code used to generate the variables and estimates in the AGRA report and in the data visualization is available in a public GitHub repository.
Ongoing EPAR research on this project evaluates the implications of using different criteria for defining “smallholder” households for conclusions on trends in agricultural transformation for those households. We have several additional visualizations including comparisons of different definitions for Tanzania, Nigeria, Ethiopia, measures of the variability of particular smallholder thresholds over time, and the tracking of 16 different smallholder categories over time.
TYPE OF RESEARCH: Data Analysis
RESEARCH TOPIC CATEGORY: Sustainable Agriculture & Rural Livelihoods; Agricultural Productivity, Yield, & Constraints; Agricultural Inputs & Farm Management; Market & Value Chain Analysis; Household Well-Being & Equity
POPULATION(S): Smallholder Farmers
GEOGRAPHIC FOCUS: East Africa Region and Selected Countries
DATASET(S): LSMS & LSMS-ISA
Downloadable Documents
AGRA Agrica Agriculture Status Report 2017
Presentation Slides